With India experiencing some of the chilliest winters in its Northern part, including the capital city of New Delhi, the region is also prone to dense fog and pollution-driven smog. And while India’s outdoor air pollution is now well documented, with Governments taking cognisance and intensifying efforts, a new Dyson report suggests, that the picture isn’t too rosy inside Indian homes either.
As a part of its first ever Global Connected Air Quality Data project, Dyson analysed indoor air quality information collected by more than 2.5 million Dyson Purifiers from 2022 to 2023 to landscape air quality in real homes across the world. This project focuses on two types of pollutants – PM2.5, and Volatile Organic Compounds (VOCs), and India hasn’t fared on either.
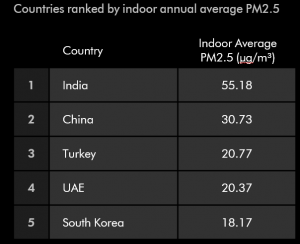
According to the report, India recorded the highest average annual PM2.5 levels, followed by China, Turkey, UAE, and South Korea, while in terms of indoor average VOCs, India ranked 7th among the top 10. Moreover, Delhi topped the list of PM2.5 levels, amongst the studied cities, with the highest indoor annual average PM2.5 levels of 69.29, followed by Beijing, Shanghai, Shenzhen and Busan.

Indoor air quality data is taken from Dyson Purifiers that are connected to the MyDyson app and in monitoring-only mode – that is, not actively purifying the space. And while that does reduce the sample size for the calculation, Dyson says it is confident that it is an accurate representation of air quality in real homes, without the impact of Dyson Purifiers actively cleaning the air.
India’s battle with pollution isn’t limited to outdoors. The study reveals that air inside our homes can be significantly worse, particularly during the winter season, with PM2.5 levels exceeding health standards set by WHO. Winter was, in general, the most polluted season across the markets – even in the southern hemisphere – where colder weather traps polluted air nearer to ground level.
Dyson data scientists have focused on PM2.5 and VOC data, analysing the measurements from 1st January to 31st December 2022. Data is collected by the machines every 1 minute, which is time-averaged into averages by hour, day, month, season and year depending on the calculation in question. For all the mean estimates, we consider the 99% credible interval to ensure accurate, statistically significant spatial and/or temporal comparisons.


